Poor JS debugging experience

I added a debugger; statement in the JS I have in ui.html and here’s what I see:

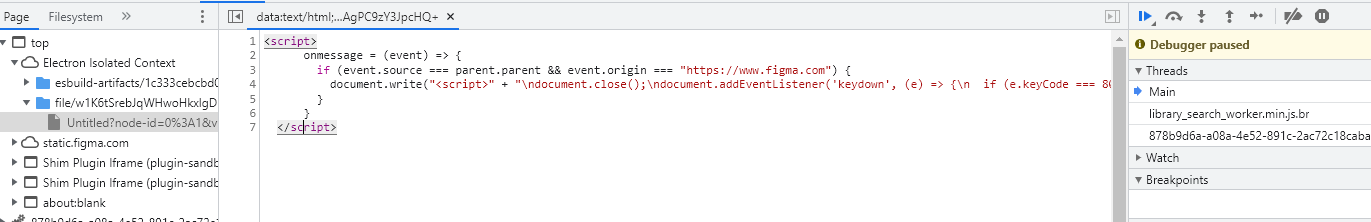
Is there a way to see my actual JS code?

Is it supposed to be like this or it’s just me?

I’m on the latest released Chrome, Windows 10, using Figma Desktop App v 116.3.8

Thanks!

+1

Feel like I’m coding in the dark. Sometimes things silent fail. But when there is a stacktrace, everything is very obfuscated.

1 Like

I feel the same. But have you activated the developer VM? If not, check this answer: How to use Developer VM

Btw, if you are bundling the JS you will also need the sourcemaps

Did you ever get to the bottom of this? I’m having exactly the same problem on Mac today. Been working on a plugin for a few days, but suddenly any debugger statement in ui.html just takes me to the same thing you posted. Can’t do anything to make it work again… have restarted Figma, turned the VM off and on again, rebooted the Mac. Nada.

Have you tried specifying sourceURL or sourceMappingURL?

For example:

<script>
    // Your code
    …
    //# sourceURL=script.js
</script>

Can you do that for JS inside an HTML file? That’s where we’re seeing this problem.

I don’t see any problems. And as you can see, the example code uses the <script> tag, which is in the HTML file.

Yes, sorry… I mis-read your post. This approach seems to be working for now, thanks!