How to use Developer VM

Hi,

I wonder if I can set a breakpoint on the Figma plugin code in Visual Studio Code or Jetbrain Webstorm.

I have researched and there is a Developer VM. I chose to run my custom plugin with Developer VM. But what’s next? How can I connect my debugger to the plugin?

The plugin is transpiled from typescript, and I have build it with inline-source-map. The breakpoint is on the typescript file, instead of the compiled JS file.

Thanks,

2 Likes

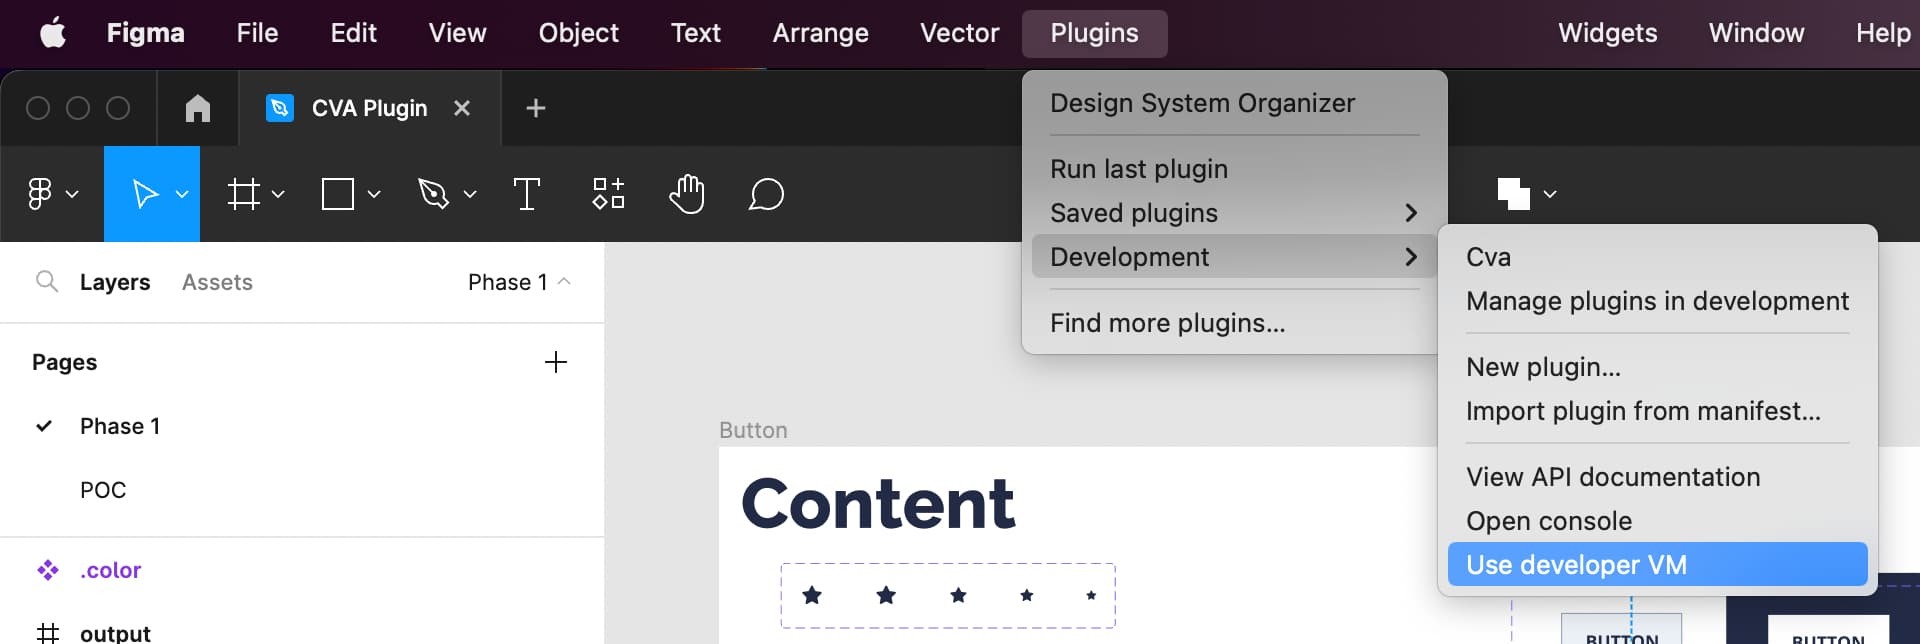
For anyone still looking for this, here is where you enable the Developer VM

It’s also worth nothing that it will show (Developer VM) in the plugin title when you open it. This is how you know that it is using the VM. I wish that menubar above also had a checkmark to show that.

The dev VM is really helpful in getting more detailed error messages and accurate location of issues in the code as well as stopping on a debuger statement.

1 Like

HAHAHAHAHA THANK YOU @Michael_Yagudaev !!! I’ve always found it odd that there was “no” indication that the plugin was running in the Developer VM!

Before I learned about the Dev VM I had already customized my Plugin’s window title and I just learned that if you do that, there’s no indication whatsoever that you are in the VM I have to keep clicking it until I got the source maps loaded

I’m reporting a bug for that

1 Like

Another important note is that Developer VM would be 10x faster than the Sandbox Mode things usually run for main.js on production.

Therefore, you want to minimize the work done there and be mindful of what you touch on the Figma canvas. It’s kinda like the DOM API in that sense, avoiding touching it too much is a good thing.

Instead doing as much work on the ui.js would be far better.