The title says almost all. I would like to kindly request a couple things regarding the Developer VM:
-
Add a checkmark to the menu item when it is activated
-
If possible, on reloads, keep the downloaded plugin code name instead of incrementing a suffix. If you are concerned about cache, just append a random query string to the request. Changing the name of the file confuses the Debugger that also has to reload all source maps
-
Improve the documentation about the Developer VM in the API docs. Essentially it says “When the option is enabled, these plugins will run in the browser’s JavaScript engine, so that developer tools can be used”. And that we need a
debuggerstatement to find our code.-
No mention to sourcemaps (hugely important)
-
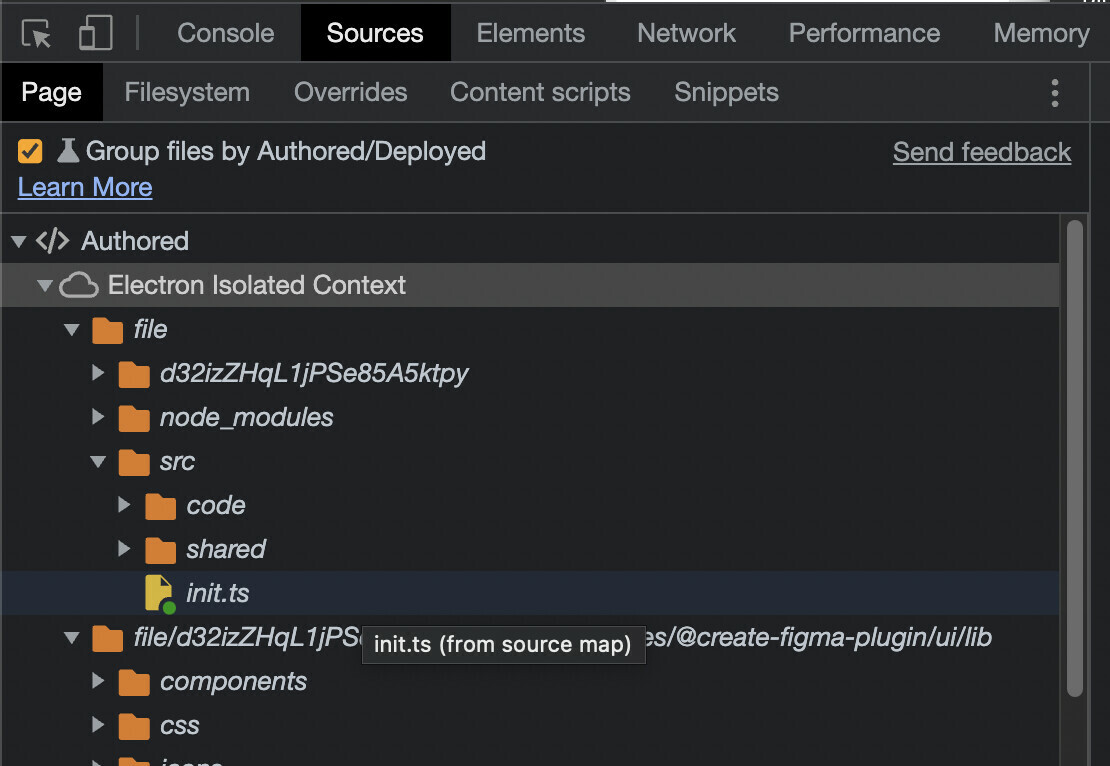
In fact, with Dev VM on you don’t need the debugger. Simply group files by “Authored” and plugin’s code goes straight to the top
-
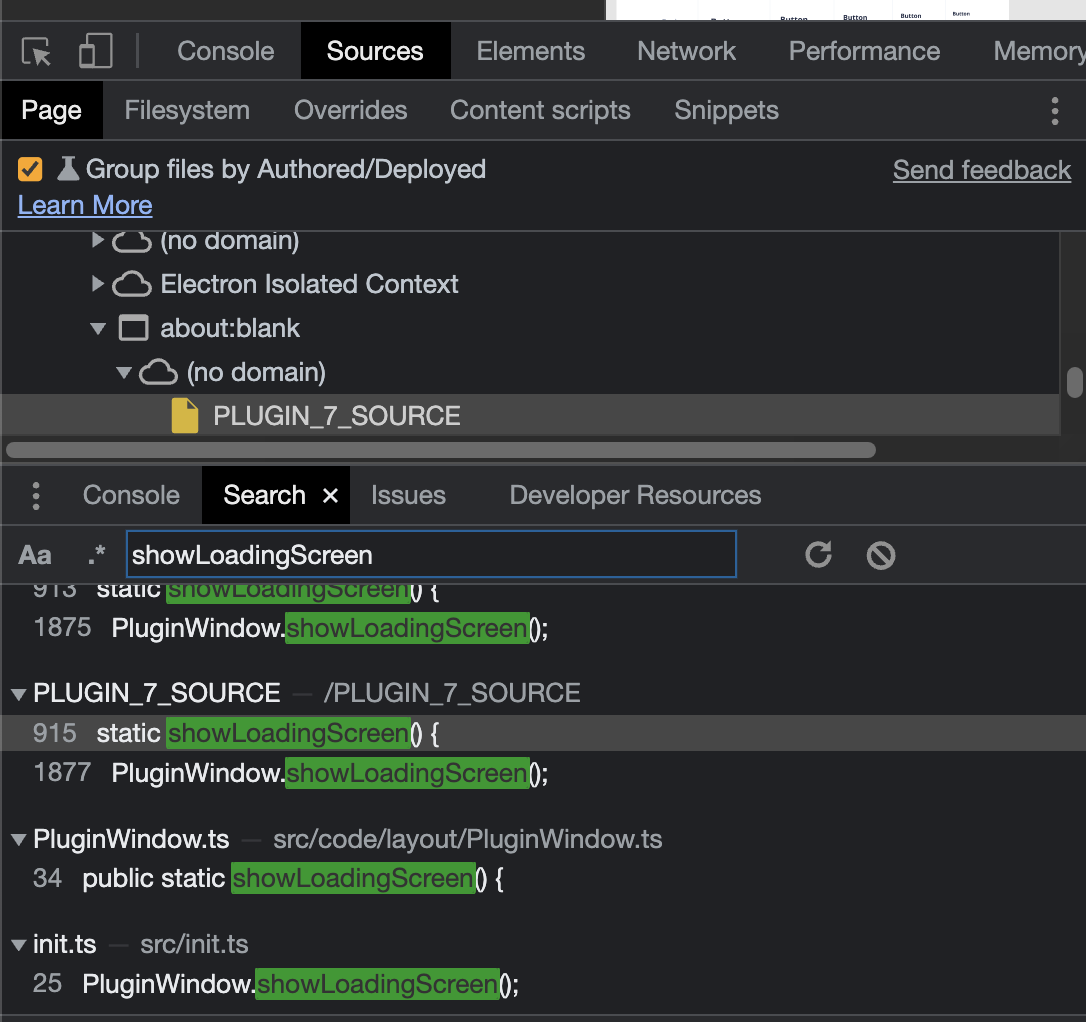
Or search for the code you want to find, set a breakpoint and you are ready to go (that being said, I just posted about figma constantly crashing when debug)
-
That kind of information would have saved me days of development.
By the way, I’m not using that stack anymore, now I’m debugging my plugin straight from VS Code. I can write a tutorial on how to debug using vs code if you guys think that’s useful to be published on the docs or whatever. I don’t really have a blog or anything, so I wouldn’t have a place to post it to make it visible to other Devs.
Anyways, I’m still having fun developing my Component Variance Authority plugin 🙂 (have you guys watched Loki?)
Thanks for the awesome product! (not being ironic here, I really like it!)
Cheers!


