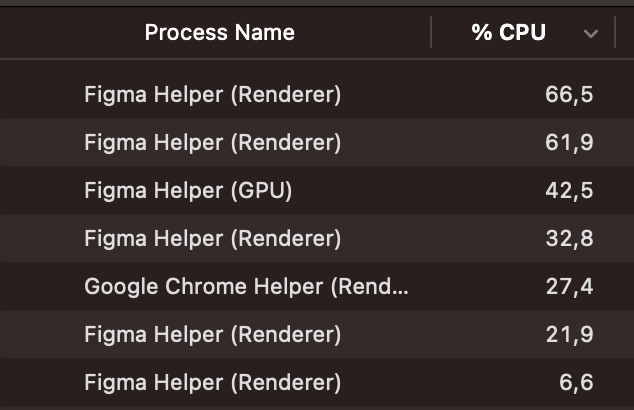
Not exclusively a UI3 topic, but I’ve seen major performance drops during this last year, another bigger one after switching to UI3.
My MacBook Pro i7 (2018) get’s to its absolute limits when I open Figma and run an MS Teams-Share at the same time. Stakeholders usually have even worse (Windows) Laptops with even more problems opening files, even though it’s readonly mode. My feeling is that until like 1,5 years ago (±) after a big feature rollout Figma may have had a worse performance for a few weeks or months but there was always a technical consolidation phase where features got streamlined and the whole app got (as good) as performant as before.
I understand that more (awesome) features mean we need more power but for me personally the biggest win and value provided would be better performance. Some KPIs for me would be:
- How long does it take to open a file / prototype?
- How long does it take to switch pages?
- How long does it take for Figma to be reactive again after minimizing / switching focus?
- How much CPU/GPU power do I need to not experience frame-drops while navigating / zooming big files / inserting components from a lib / inserting big media?
Thank you so much for constantly improving Figma <3
2 Likes
Hey @Alex134, thank you for taking your time to leave your feedback!
I do understand your frustration and apologies and sorry for any disruption to your work! I can definitely get you connected to our technical support team so you get help. I’d recommend the stakeholders to reach out to us as well, so we can investigate the performance issues further.
Before getting you connected to our team, could you clarify if this issue is also occurring when you open Figma in the browser? Our supported browsers are Chrome, Firefox, Safari and Edge.
If the issue seems specific to the desktop app, we would recommend trying to clear the desktop app cache (Clear the Figma desktop app cache)
Does this also happen on another network, like a mobile hotspot?
VPNs and other network security can sometimes block loading only for specific files or at certain times of the day. We recommend checking our Troubleshooting checklist and how to Adjust your network settings if you connect through any network security and contacting your IT Admins if this is a shared network.
I’ll check the KPI’s with the team, will get back to you soon.
I’m having a problem with performance too with the new UI. Switched back to the old UI - the problem solved.
iMac (Retina 5K, 27-inch, 2017)
3.4 GHz Quad-Core Intel Core i5
24 GB 2400 MHz DDR4
Radeon Pro 570 4 GB
1 Like
Hey @mlambrian, thank you for sharing your details!
Are you able to give your more information about your performance issue?
Did this happen in the browser, the desktop app or both? On a certain file or on all files? What exactly did you see on your end?
It would be great to have more details on this so I can pass this along to the teams. Are you able to get a screen recording?
Thank you,
Gayani
Same problem here:
My computer goes crazy hot when I start working on Figma desktop app since the update to UI3. I tried reverting to UI2, but it consumes the same amount of resources anyway.
When I work on something that needs to be spread around multiple elements in the file, the ventilator turns on and on.
And two weeks ago it never/rarely occurred.
Computer characteristics:
3,7 GHz 6-Core Intel Core i5
Radeon Pro 580X 8 GB
8 GB 2667 MHz DDR4
MacOS 14.7
Hey @Anelia-IMT, thanks for confirming! I can get you connected to our technical support team.
Before that you please try the following:
- Force-quit the Figma Desktop app and restart it.
- Clear out your cached files Please follow these steps: Clear desktop app cache.
Could you confirm if you’re able to update to macOS 15.0.1?
Please let me know if clearing the cache resolved the issue. Happy to help further.
Hey @Gayani_S ,
I am not planning on updating to MacOS 15, because of the hardware of the computer, I don’t think it is a good idea.
On the other hand, restarting the app or the computer does not solve the problem.
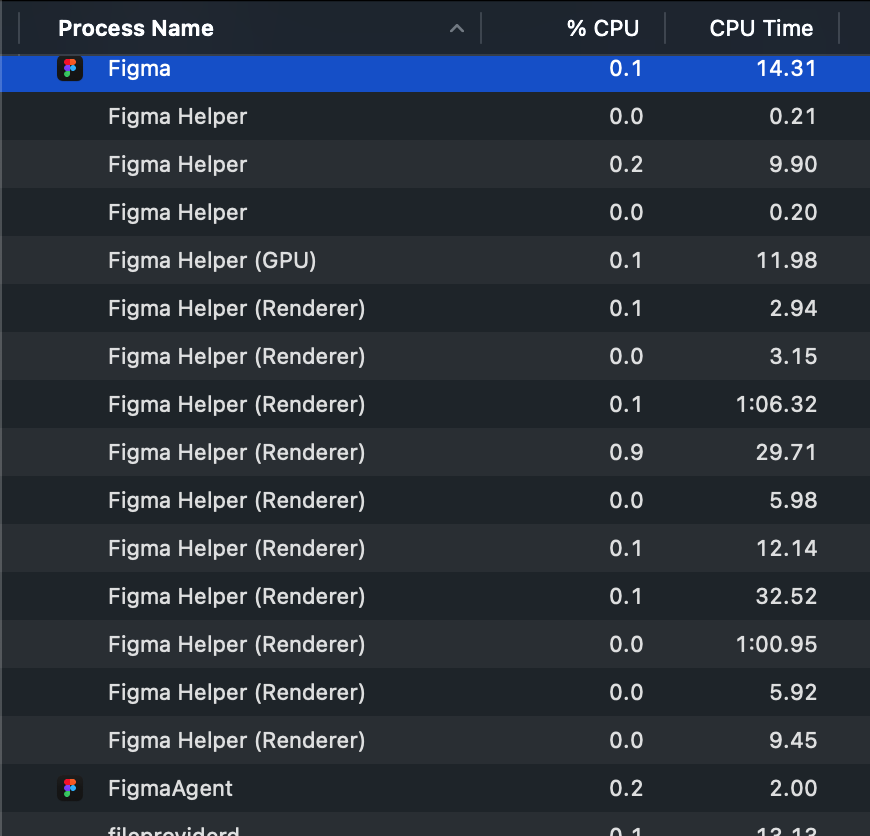
Take a look at the processes from my Activity Monitor this morning:
Why so many processes?
It does not maintain this amount of processes at all times, but it is consuming a lot more than before, for a reason I don’t know.
If your dev team can optimize it for older hardware computers it would be much appreciated.
Hey @Anelia-IMT, thanks for getting back to me.
I’ve just created a support ticket on your behalf so that the team can investigate what’s causing this.
Your ticket number is #1153762, for reference. Someone from support should be in touch with you soon.
Our support team usually takes up to 24 hours to reply back to emails - tends to be quicker than that in normal circumstances. However, please be aware that we are facing increased contact volume so there might be a delay.
Appreciate your patience in the meantime!