Hey Sohrab,
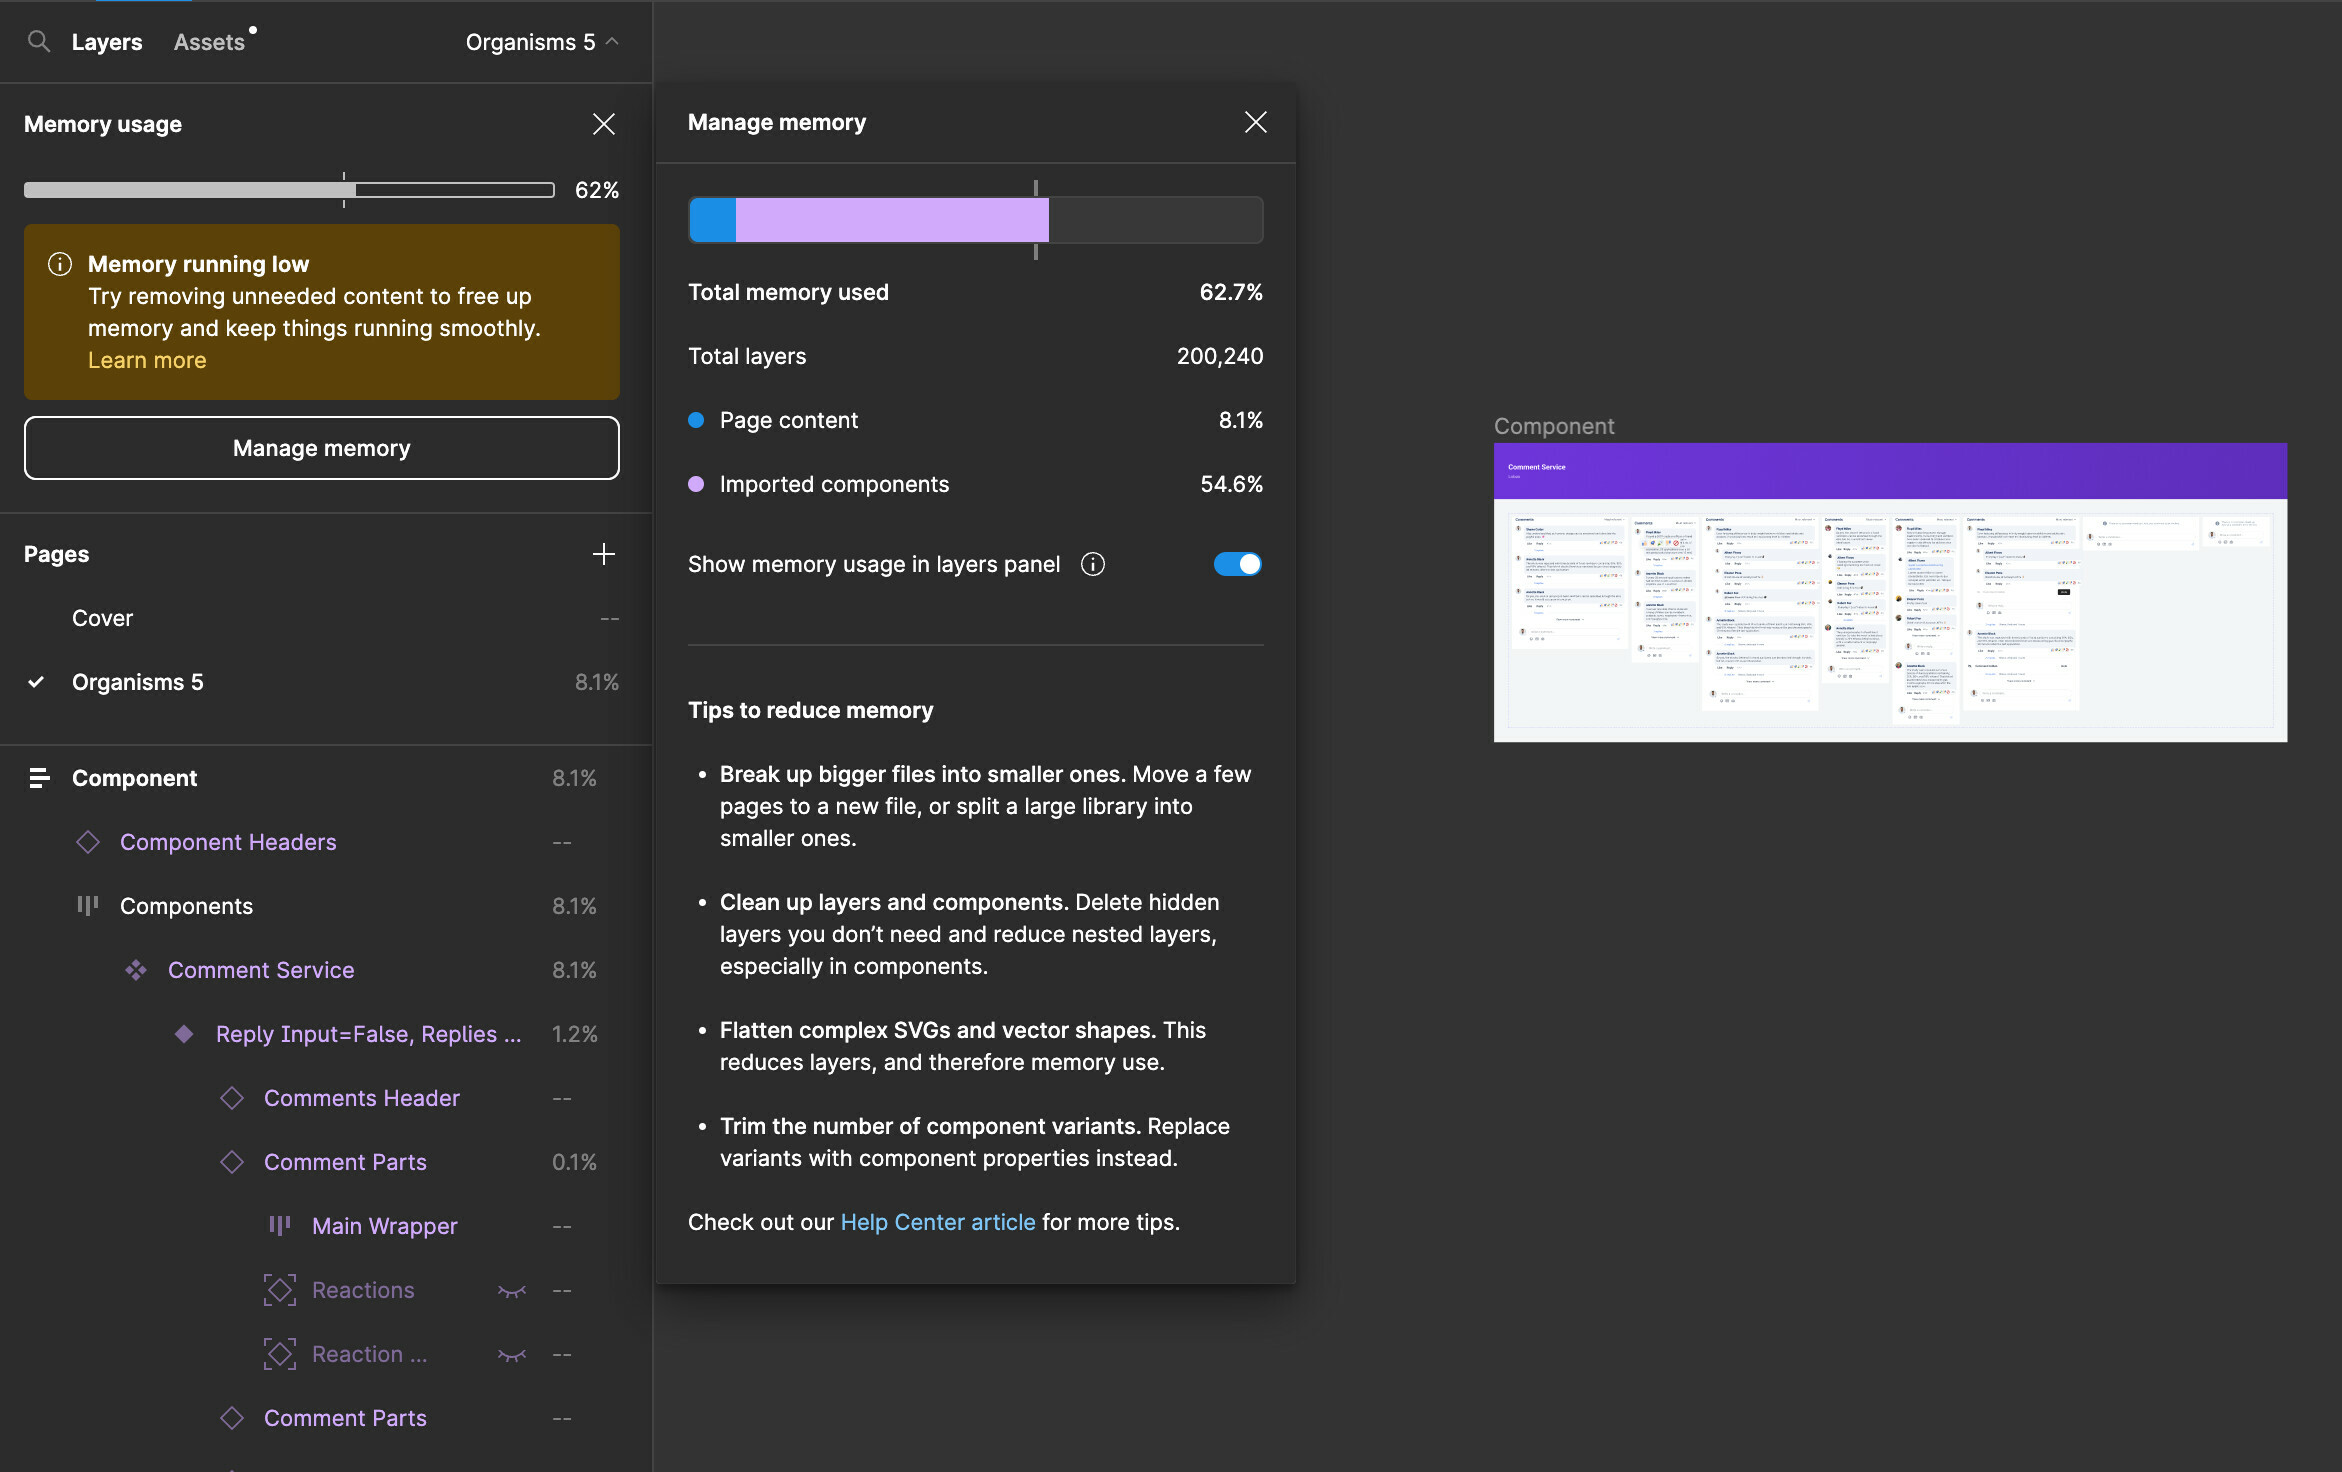
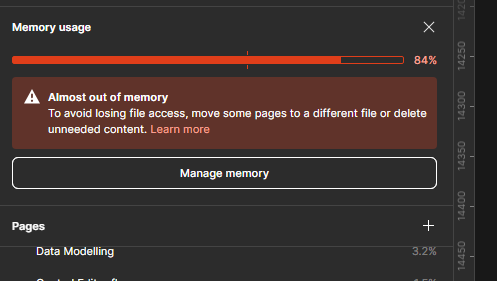
Sorry to hear you are having issues with the memory limit! The “Show memory usage in layers panel” is the only way to check the memory usage in your panel.
To give you more insight about “Imported components”, they are local copies of external components that are created and reside in your file when you add an instance of a component from an external library to your file. These local copies are not visible to users on the canvas but they consume memory and are needed to establish a connection between your instance and the external main component.
These local copies will remain in a file as long as any instances of an external component (even those that have recently been deleted or moved from an external library) are present in your file.
As a workaround, the memory used by these imported components can generally be lowered by updating their external main components after reducing their memory usage (https://help.figma.com/hc/en-us/articles/360040528173-Reduce-memory-usage-in-files#reduce) or by actively removing or detaching all instances of external components which you no longer need in your file. (to search your instances in use: search for the instances in the search bar - however this may not capture instances that have been renamed). Hope this helps!


