Question

How do I design a graph with hover over state that fully shows, when using Auto Layout to create bars.

  • June 16, 2025
  • 1 reply
  • 17 views

Rianne

When designing a barchart in Figma, I run into this problem:

  • I created the bar as a component with hover over state
  • The hover over state contains a visual showing the exact metrics
  • I designed the bar in Auto layout to create entries for each day (x-axis represents days of the month)
  • The bars are created in Auto Layout and do not overflow, using Clip Content does not work

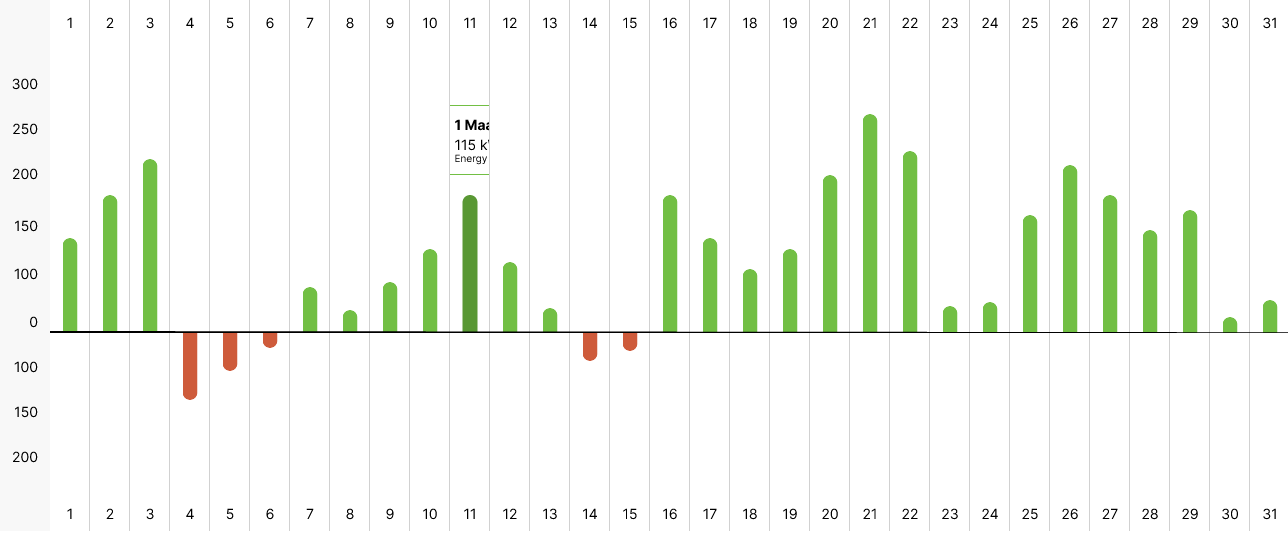
What I like to do is show the whole hover over element without it being cut off by the next ‘Auto layout’ bar, see screenshot below, and video for reference.


Here is a video of how the prototype works and how I setup the file: 
 

https://www.loom.com/share/9e792ed5a14b4f8ba837fe5d8314bdf7?sid=5fb3ed4d-5eb1-41bb-8885-a866e76b9fb6


Hope someone can help me out here :) 
Thanks! 

1 reply

driftingsteps

Try keeping the graph lines and everything static in a separate frame.

Then, for your interactive bars, put them in an autolayout layered above the graph lines.

You can't keep your bars in frames named "Dag". All the green bars should be in a single autolayout, and you need to use paddings and spacings to align with the graph lines.

Additionally, in autolayout settings, set the canvas stacking to "First on top" if you come across tooltips being hidden by the adjacent green bars.


Reply


Cookie policy

We use cookies to enhance and personalize your experience. If you accept you agree to our full cookie policy. Learn more about our cookies.

 
Cookie settings