Significant performance drops while working with nested components and design systems

Greetings!

I’d like to report issues with Figma’s performance when working with both components and prototypes. I’ve got multiple files with a descent amount of frames and quite a lot of nested components. I’ve tried splitting everything into multiple files, I’m using variables/properties, but even with those techniques as soon as I update a single line of text in a component everything lags like there’s no tomorrow.

From what I can gather, the lagging occurs as Figma is trying to update all component instances. I’ve tried splitting the design system into various files as I mentioned, so that it doesn’t have to update everything at once, but it still struggles a lot and for a second (…or ten. Or more.) the file becomes virtually unworkable. It even shows the cloud icon saying the file has unsaved changes, despite my connection being solid.

The thing is… it’s not the delay when it’s updating instances that’s bothering me. It’s the fact that any changes are synched rightaway, which makes editing a component incredibly slow.

For instance, I have a card component that’s using other components inside (imagine a card with rows of text). The inner components are stored in a separate file, no changes being done to them. So I take a bunch of cards like that and use them in a larger frame — like a view of a web app. That larger view I make into a component also, so that I can place its instances next to it, shrinking/expanding their sizes (to show how the auto-layout works on 4 breakpoints).

So, in total: component #1 — a card (uses smaller components from another file), component #2 — a webapp view with 10 cards, and about 12 instances of component #2 next to it.

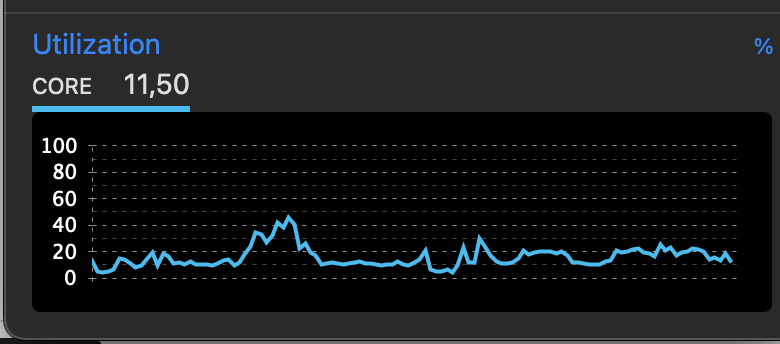
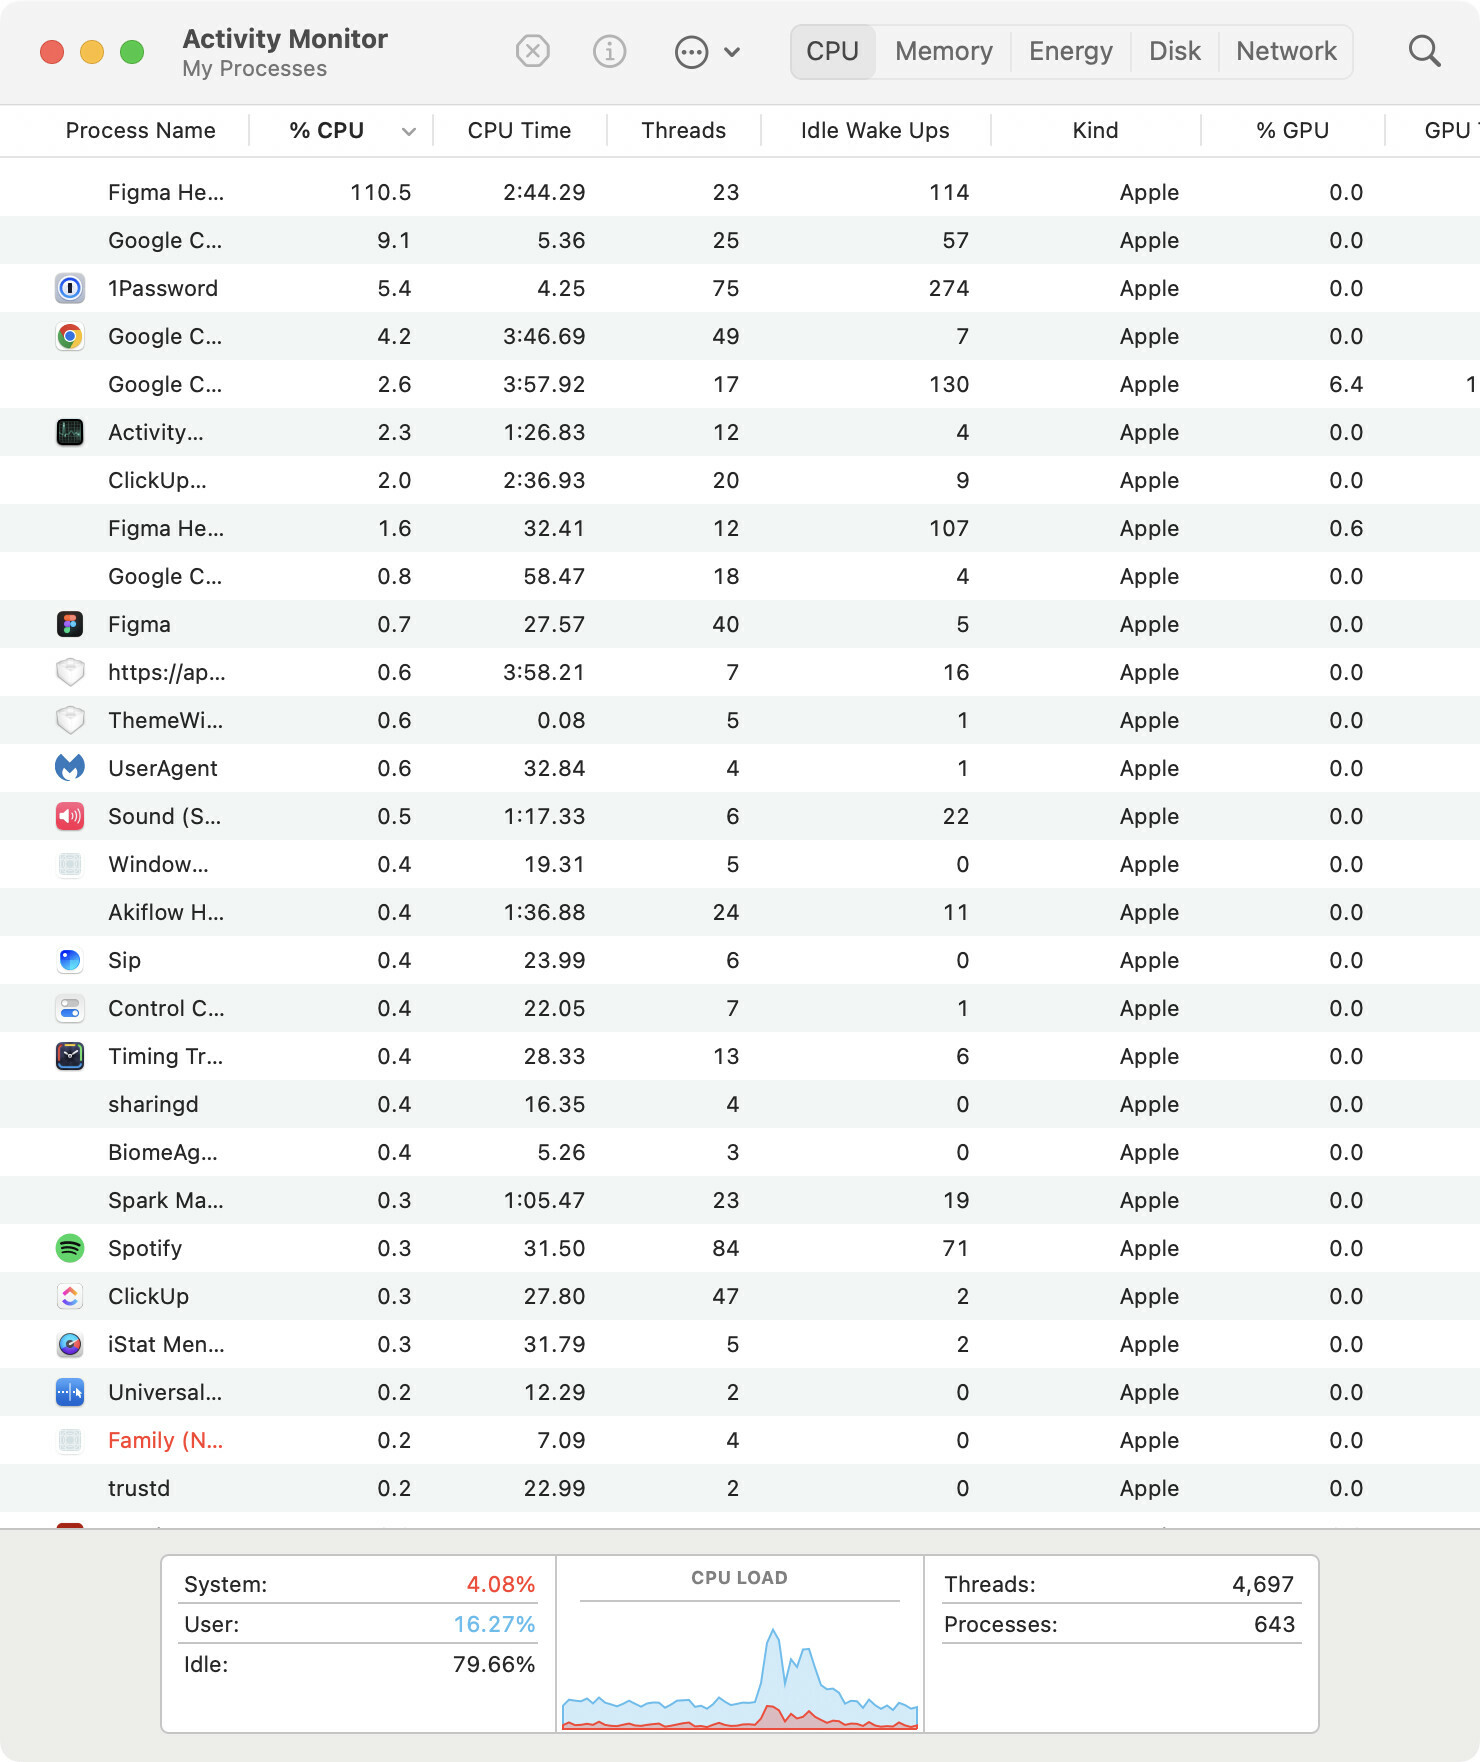
That doesn’t seem excessively large, given how I’ve seen design systems way larger at my last job. And yet, both editing any text inside component #1, its instances within component #2 and playing the prototype is just abysmally slow. I’ve got a relatively capable MacBook Pro 2019 with a hexacore CPU, more than 4GB or RAM is free (16 total), the computer isn’t utilized fully, CPU load is pretty low. I feel like it’s some kind of Figma’s “engine” bottleneck.

But it gets better! Placing a separate frame with the same card compoment, with nothing in it, just the card — the hover animation between 2 card variants lags still. Even if that new frame doesn’t have any instances, just a frame. So it’s like the whole file or anything inside of it lags.

I’ve tried cleaning the caches, I’ve reinstalled the app last night, I’ve tried it on a dedicated GPU — nothing. I’ve sent it to other people and they confirm it lags on their machines as well.

I seem to recall being able to make larger prototypes and they worked well on an M1 MacBook Pro 13. Our DS has loads of components in various files, but isn’t that… the idea? So I can’t imagine how larger products are able to work with hundreds of screens/frames since it doesn’t seem to be dependent on my laptop’s performance. If this little thing can handle a modern game at high settings (Fallen Order, High, ~40fps, AC Unity Ultra High — 50-60fps), it should probably be able to handle a Figma prototype :slightly_smiling_face:

Please let me know where I can talk to someone about it, I’m willing to provide any feedback or details if it helps resolve this issue.

Best regards,
Paul

P. S.
Published design system updates often wouldn’t apply to a current file when I press the “Update all” button — nothing happens. I’ve had to reload a tab multiple times today alone to see changes from other files. It’s like after a certain amount of complexity the app just struggles.

2 Likes

Hello! I have the same problem. I can not make 3 layer side navigation. I have lots of nested components inside and it’s bugging…(((( I re-did side nav several times but it became worse

Hi @pavelsoyfer, Thank you for bringing this to our attention! I understand your frustration regarding the performance issues. We also appreciate you taking the time to troubleshoot.

While we would like to offer more assistance here, it’s a bit challenging to investigate the cause of this issue without a closer look at your file.
Therefore, I recommend reaching out directly to our support team for help: https://help.figma.com/hc/en-us/requests/new
To assist our support team in investigating, kindly provide the following information:

  • Please make sure to use your Figma account email.
  • Share the direct link to your file, and add support-share@figma.com as an Editor to the file (this won’t impact your billing).
  • It would be extremely helpful if you could provide a video recording of the issue you’re facing.

Additionally, you may already be aware, but the tips provided in this article might be helpful in addressing your situation: Tips for reducing memory

Also, Thank you for informing us about the issue regarding Review and accept library updates (in P.S. section). It’s available on any paid plan and for anyone with can edit access.
If the issue persists, please don’t hesitate to reach out. I can divide the topic to provide further assistance if you want.

I hope this information is helpful. Please let us know if I misunderstood anything.
We also welcome any suggestions or insights from our community, so feel free to share!

Thank you,

Hi there, just wanted to add that I’ve tried viewing a prototype of a website I did a while back and on the same laptop, same OS version, etc. etc., it now works slower. Even when using my discrete GPU, simple hover transitions on buttons lag. There’s a very noticeable lag between the cursor moving onto a button and it animating to its hover state. And that project is a lot less complicated than the design system I’m currently working on.

So… It doesn’t seem like these issues are on my end. Even if I’m working on a relatively large frame, like a desktop web page, around 1600x7000px, button animations should work well, otherwise what’s the point in having them.

I’ll try to contact the support team now.

1 Like

Hi @pavelsoyfer, Thank you for providing us with the additional information!

I appreciate you reaching out to our support team, and I can see your ticket (#963173) in our system. Our support team is currently working on it and will contact you to provide assistance.

Thank you,

Hi there! I’m experiencing the exact same symptoms with nearly the same scenario that @pavelsoyfer reported.

In an attempt to troubleshoot, I moved a page I’m working on from the primary file I was working with in an attempt to reduce memory/CPU. I then reduced the number of components to the minimum besides removing the design system components which has helped some - however my CPU regularly hits over 100% usage on a 2023, M2 Pro Mac. The lag has rendered my workflow to nearly unusable as I wait for 1-10 seconds for even the smallest change (including typing a letter).

Curious to hear if there was a solution that came out of the support ticket or if I should file an additional one. Thanks in advance!

@ Jordan_Campbell1

M2 Pro is a pretty capable CPU, I find it a bit odd you’re able to push it to 100% with Figma. Are you running some stuff in the background by any chance?

I’m on a MacBook Pro 2019, 6-core i7 and I’ve just tried opening a file with like at least 60 frames (they’re all instances, but it’s still a lot for Figma to render) and also tried updating my library aaand also tried viewing a prototype. The hover interactions in the proto lag, there’s a 5 second delay between when I hover over and the hover state appearing. And yet my CPU barely hits 60%. AMD GPU is active also, so there’s no earthly way I’m performance bottlenecked.

I was under impression the M1/M2 Pros are basically “gods” among CPU and they tend to outrun Intel based on what I’ve seen. I recall working on a stock M1 on a 13-inch MBP a few years back and somehow it ran huge design files like it was nothing.

So I’m a bit curious to ask about your situation since 100% CPU is what I’d expect from rendering a scene in Blender, not Figma. :slightly_smiling_face:

(Screenshot from Intel Power Gadget)

Yeah absolutely, happy to expand! I put together this Loom to go through the situation on what is nearly a blank-state file as well as what eased the problem. Here’s also a screenshot of the activity monitor status.

I’ve closed my exuberant amount of Chrome tabs to weight that and other programs out - closed out other intensive apps as well to rule that out.

It could be that I’m using an intense component and would be better off utilizing a series of variables like I explain in the video.

What worked for me (temporary and not ideal) was removing the intensive component’s variants and whittling it down to a base component without prototyping and without interactive tabs/filters until I can replicate the old interaction via variables.

I’m assuming you’re referring to the 110.5% CPU column? As far as I know and just Googled, Activity Monitor has this thing where it shows you CPU % for multiple threads as a sum of values for each thread, so what you’re seeing could just as easily be some abstract load for two threads, one of which is at 100%, plus some load on the other.

Check out out the bottom stats in the Activity Monitor — you’re idling at 79.6%. I’m seeing some peaking in the blue chart (User, that’s you and your apps, Figma included), probably up to 80s, but it’s kinda okay for a CPU to peak to a higher load value on occasion when it needs to, well, load stuff. Mostly you’re showing load values similar to mine, judging by the chart, but AM is also pretty infamous for inaccurate stats (or so would Mac forums have you believe).

If you’ve got a spare minute — I recommend trying out an app like iStat, I think there’s a free version available called “Mini”. It’s a monitoring widget, same idea, but I’d trust its values a bit more. Overall I doubt Figma is ever able to load your M2 to it’s 100%.

Also. I’ve watched your video and oh man, I get it. My current project is of similar complexity, with multiple design system files and absolutely — editing a master component, even if I’m just editing text, the document freaks out and tries to update all the instances right away. I talked to Figma support about it some more and I believe they’ve confirmed that it’s Figma trying to loop over every single instance and that’s what causes the slowdown. I even get the same “Document has unsaved changes” prompt as I saw in your clip (the dot next to the tab name). Mine struggles a little bit less now that I’d moved stuff around into multiple files, but even still, these slowdowns occur regularly.

Has your performance always been like this? Because I could swear for some reason I’m certain it kinda used to run better. Like I mentioned before, the base M1 (not even a Pro, an entry-level M1) seemed to handle pretty large files, many of them, with a huuuge design system at my last workplace in 2022. And now you’re experiencing performance issues on a M2 Pro which is a spaceship compared to that M1, so idk, maybe I’m imagining things, but my hunch wants to keep asking if there’s been some under the hood changes recently within the app.


Here’s my clip. I’ve updated an icon and that icon component is used in a bunch of components on a different page in the same file and as soon as I touch it, the file becomes laggy and the app FPS drops as if I’m running Cyberpunk2077* in the background :sweat_smile:

*a really demanding video game

I’ll definitely check out iStat for a more accurate read - appreciate the recommendation!

That’s what I was assuming too, that the complexity and looping of every instance is causing it to be overloaded.

From what I researched and your feedback, the best method for me now is utilizing setting variables for the time being. Thanks for the context you got from support as well!

I’m experiencing the same problem on a Mac mini M2 Pro with 64GB. My buttons have become very unresponsive. It takes lately between 2 and 4 seconds to change from default to hover state while hovering.

Same problem with countless support tickets submitted and still no resolution. Our prototypes are unusable. And our design system file which used to work very quickly has slowed to a halt and publishing is nearly impossible. 20-45 minutes to publish and usually the publish just times out.