

Tarun_Ottur
February 16, 2024
Question

Discrepancies in Figma Library Analytics

  • February 16, 2024
  • 14 replies
  • 549 views

Hi Figma Community,

Upon looking at the usage data of our components within the Figma library analytics, I’ve noticed some discrepancies when delving into deeper levels of analysis.

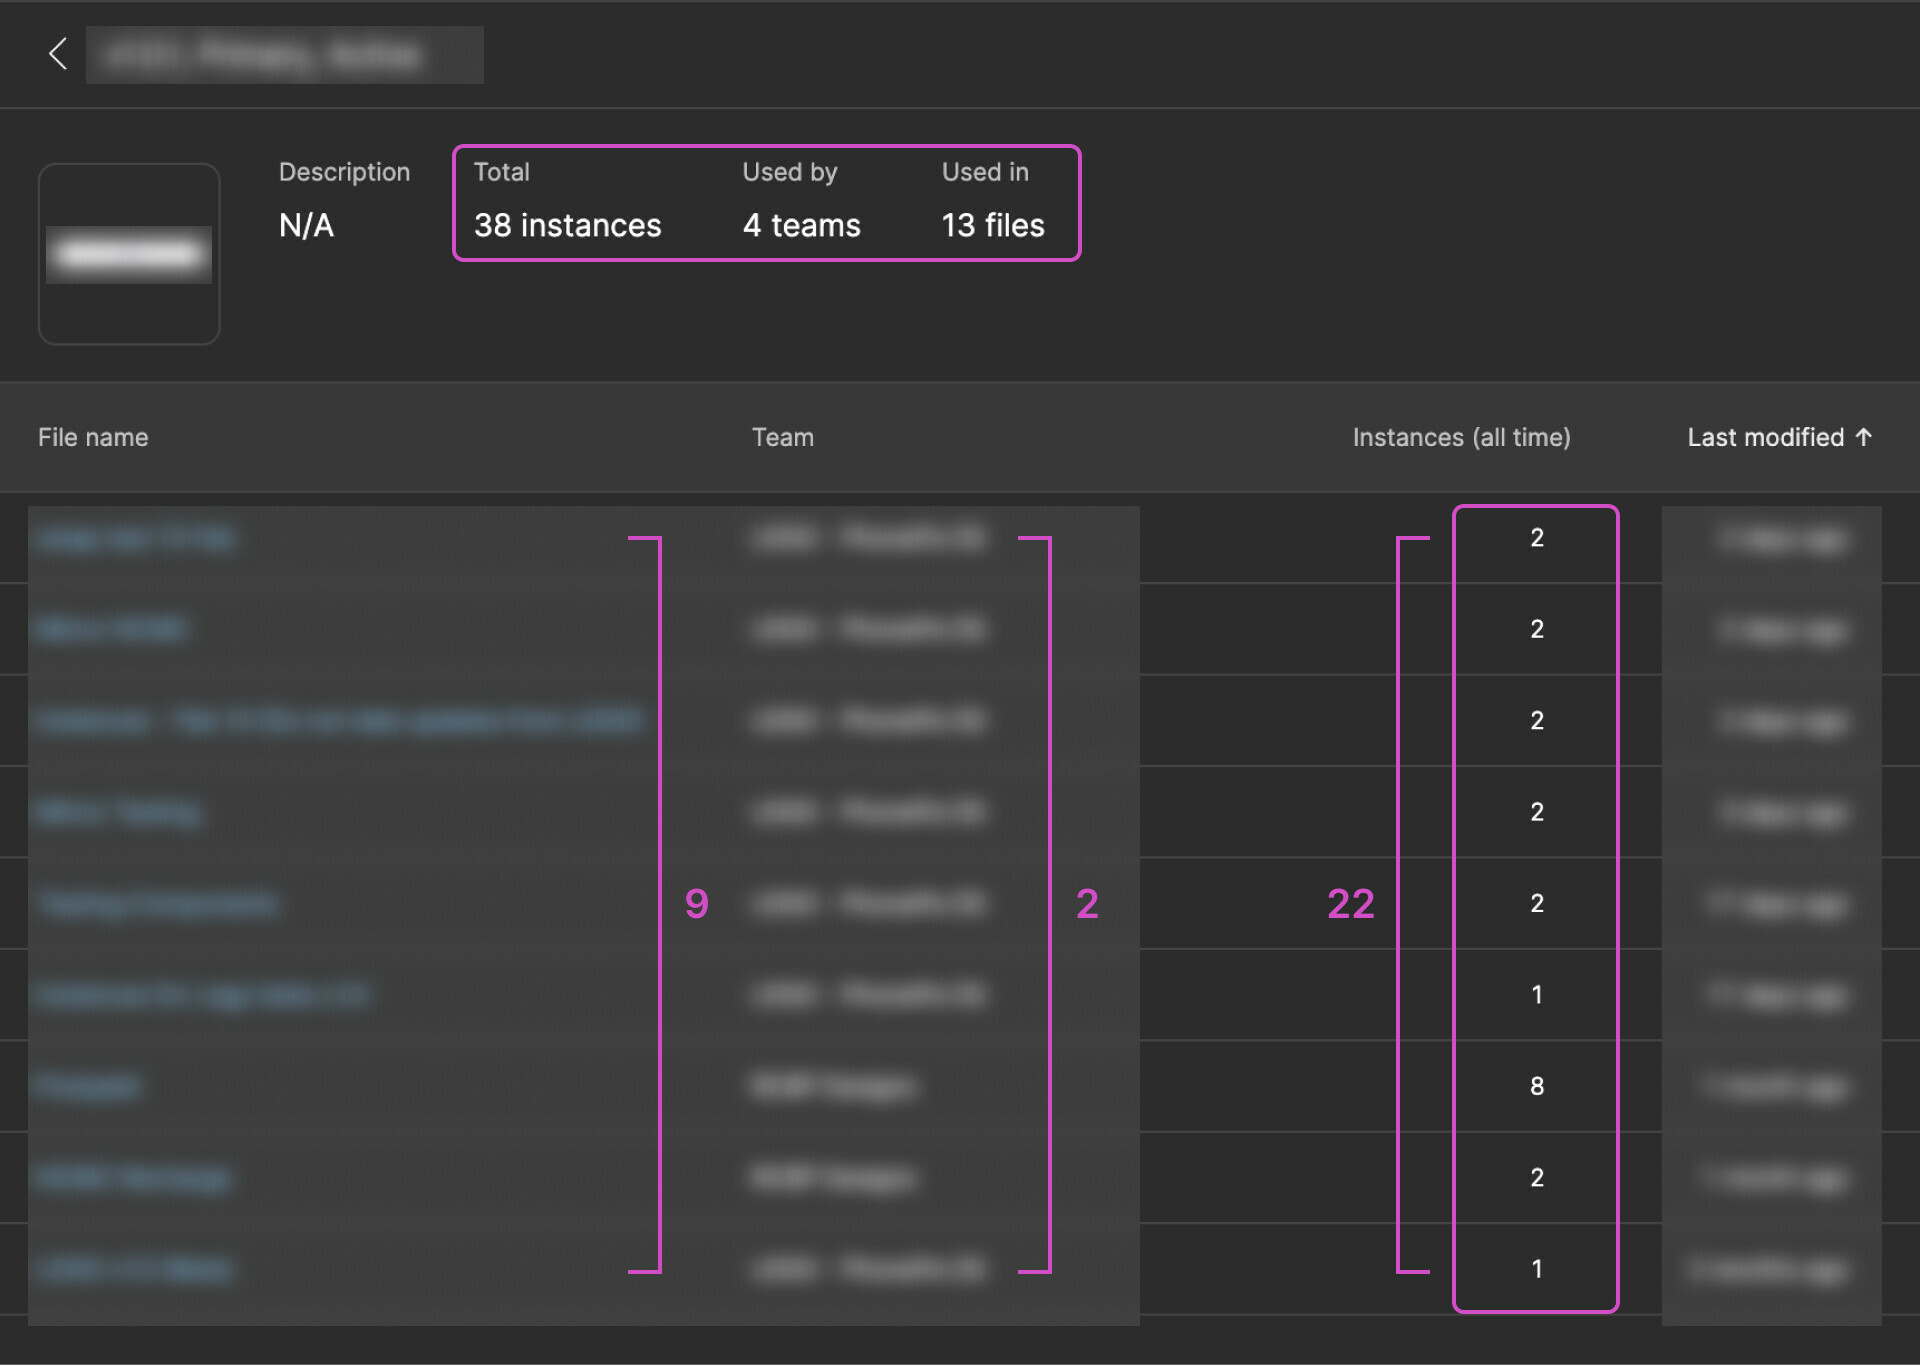
Below, I’ve included a screenshot depicting these discrepancies at the instance level. You can observe that the total count displayed at the top doesn’t align with the sum of individual values.
Has anyone else encountered a similar issue? Any insights would be greatly appreciated.

Thanks,
Tarun.

This topic has been closed for replies.

14 replies

Gayani_S
Figmate
Community Support
November 14, 2024

Hey @Veneruso_Annie! I reached out to the team and got some insight that may help clarify this.

It turns out the chart can be a bit tricky to interpret. Each point represents the number of insertions over the previous 7 days (weekly), so it’s showing about 20,000–25,000 insertions per week over the past 30 days—adding up to roughly 80k–100k total. The table at the bottom of the modal should show 30-day numbers that align with that total.

Could you let us know if you were viewing the chart as a rolling 30-day insertion total? And if possible, could you confirm where you’re pulling the total number from on the chart?

Thanks for your patience as we sort this out!

Veneruso_Annie
New Participant
November 14, 2024

Thanks @Gayani_S, I understand. So the “Component insertions” chart when set to a duration of 30 days will display the last 30 days in weekly increments.

The data point on Nov 2, for example, that number is the total number of inserts for the period of Oct 26-Nov 2 (around 21,000).

The total I was referencing was if I added the button, link, and icons “Inserts (30 days)” amounts together, which confused me, as I thought the chart above was reflecting a 30 day value total and not a weekly value total.

Question: So currently, would it be right to assume that to find out the weekly component inserts by component name, it’s currently difficult to do? (Instead of “Inserts (30 days)” something like a “Inserts (7 days)”)

Gayani_S
Figmate
Community Support
November 19, 2024

Hey @Veneruso_Annie, let me double-check this internally with the team, so I can provide you with accurate information. I’ll get back to you as soon as I hear back.

Appreciate your patience in the meantime, and I’ll make sure to keep you updated!

Gayani_S
Figmate
Community Support
November 21, 2024

­Hey @Veneruso_Annie! The team gave me the following information:
If you’re on an Enterprise plan, the Library Analytics REST API (currently in public beta) does allow for week-by-week analysis.

Specifically, the /component/actions endpoint documented here would have the data you’re looking for: https://www.figma.com/developers/api#library-analytics.

Let me know if you have any further questions.