
June 27, 2023
Solved

Is it possible to perform step debugging & data inspection for Figma plugins?

  • June 27, 2023
  • 6 replies
  • 1978 views

I’m developing a Figma plugin using VS Code and previewing the plugin on the Figma desktop app.

I understand that VS Code has the option to inspect variables and debug step-by-step while debugging, but it seems like that’s only possible if I run my plugin from VS Code instead of Figma app.
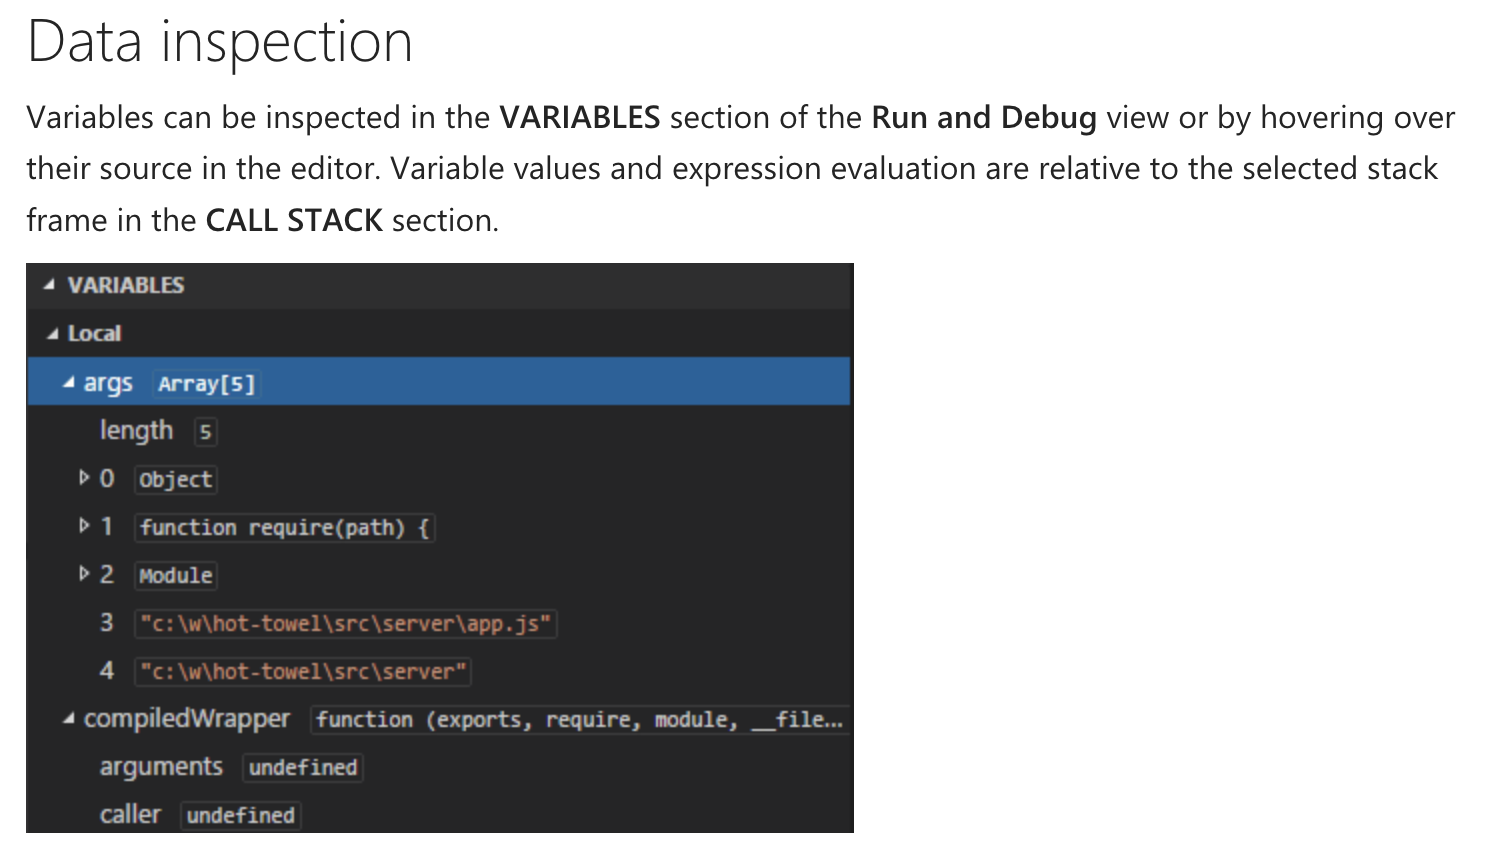
I was wondering if it’s possible to perform step-by-step debugging and data inspection from Figma app’s console as well? It would greatly speed up development if I didn’t have to type console.log every few minutes to troubleshoot

This topic has been closed for replies.
Best answer by tank666

I think you will also find the following resources useful:

Chrome for Developers

6 replies

tank666
July 2, 2023
UX/UI designer. Figma expert. Creator and developer of plugins and widgets for Figma and FigJam. Check out my resources in Figma Community: figma.com/@tank
Zack_HongAuthor
July 3, 2023

From this article, I can’t figure out whether I can perform step-by-step debugging from Figma app’s console. All I can tell is that:

a) you can type out certain specific figma nodes ie figma.currentPage to inspect their properties
b) any console.log() statements in my plugin code will appear here

What I’m looking for is the ability to execute my plugin code one line at a time, and observe which variables are set, or which events are being called. I’d like to find out if this is possible for Figma plugins?

tank666
July 3, 2023

You probably didn’t read this article to the end. It also mentions that you can run the plugin in the developer VM, add a debugger statement where you want to pause code execution, and then add breakpoints in DevTools to debug the code step by step.

UX/UI designer. Figma expert. Creator and developer of plugins and widgets for Figma and FigJam. Check out my resources in Figma Community: figma.com/@tank
Zack_HongAuthor
July 3, 2023

Thanks, didn’t know that the Developer VM referred to the debugging options for the plugin. I also didn’t know that you should literally insert “debugger;” statement into my projects files eg ui.html or code.ts to make it work

I also didn’t know that you could mouse over variables inside the dev console in the Figma app to view their values when it pauses at the debugger statement:

As someone who’s only ever debugged using IDEs like VS Code, I totally didn’t understand the section about Developer VM. I think the point could have been brought across clearer if they included some example screenshots as well

tank666
tank666Answer
July 3, 2023

I think you will also find the following resources useful:

Chrome for Developers
UX/UI designer. Figma expert. Creator and developer of plugins and widgets for Figma and FigJam. Check out my resources in Figma Community: figma.com/@tank
Zack_HongAuthor
July 4, 2023

Thanks, these articles are really helpful!